Collect browser's console logs and network usage
Some issues on the client side, specific to a user can be difficult to troubleshoot if we don't have the detail information of what's going on the user's browser. The console logs allows us to debug issues that happen on your browser.
Chrome or Edge (Chromium based browsers)
Chrome Console logs
- Click on the 3 dots menu in the Chrome's navigation menu.
- Go to "More tools" and then "Developer tools.
- Click on the "Console tab" in the Developer Tools panel:
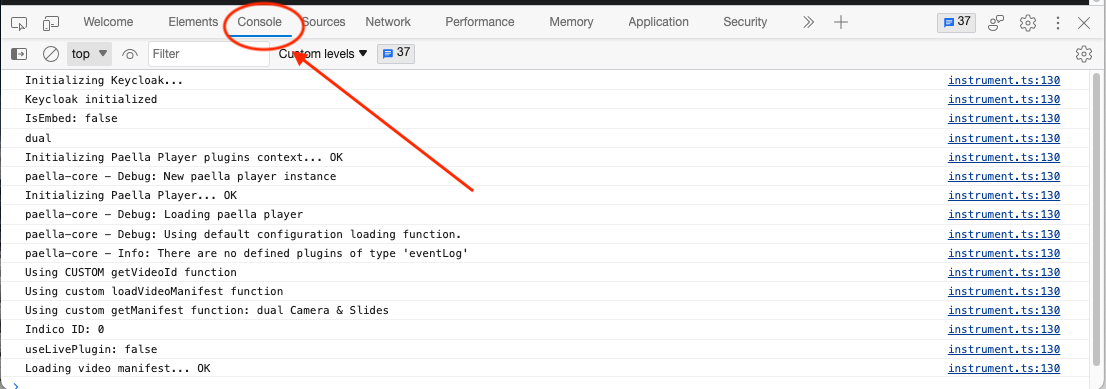
- Ensure that at least, the "Verbose", "Info" and Errors" log levels are selected.

- Right click on the log area and select "Save as..."
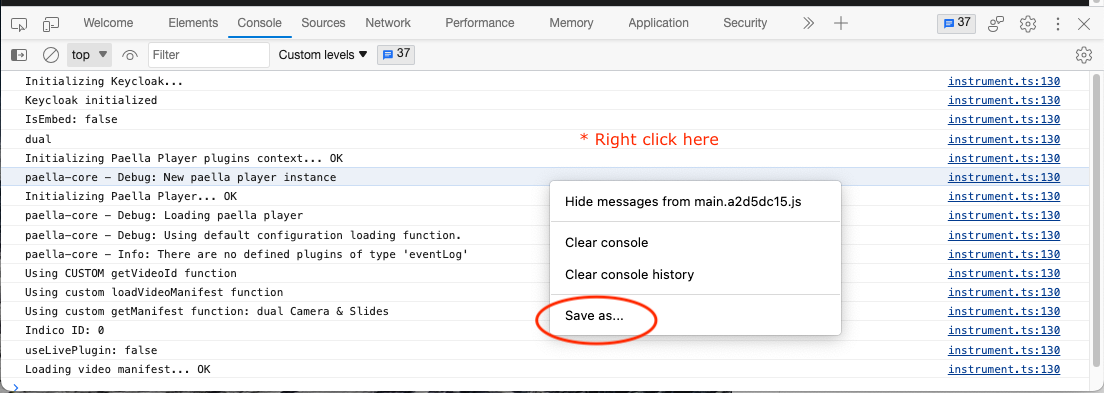
- Finally open the file, copy it's content and add it to the ticket or share the file on the ticket.
Chrome Network usage
- Click on the 3 dots menu in the Chrome's navigation menu.
- Go to "More tools" and then "Developer tools.
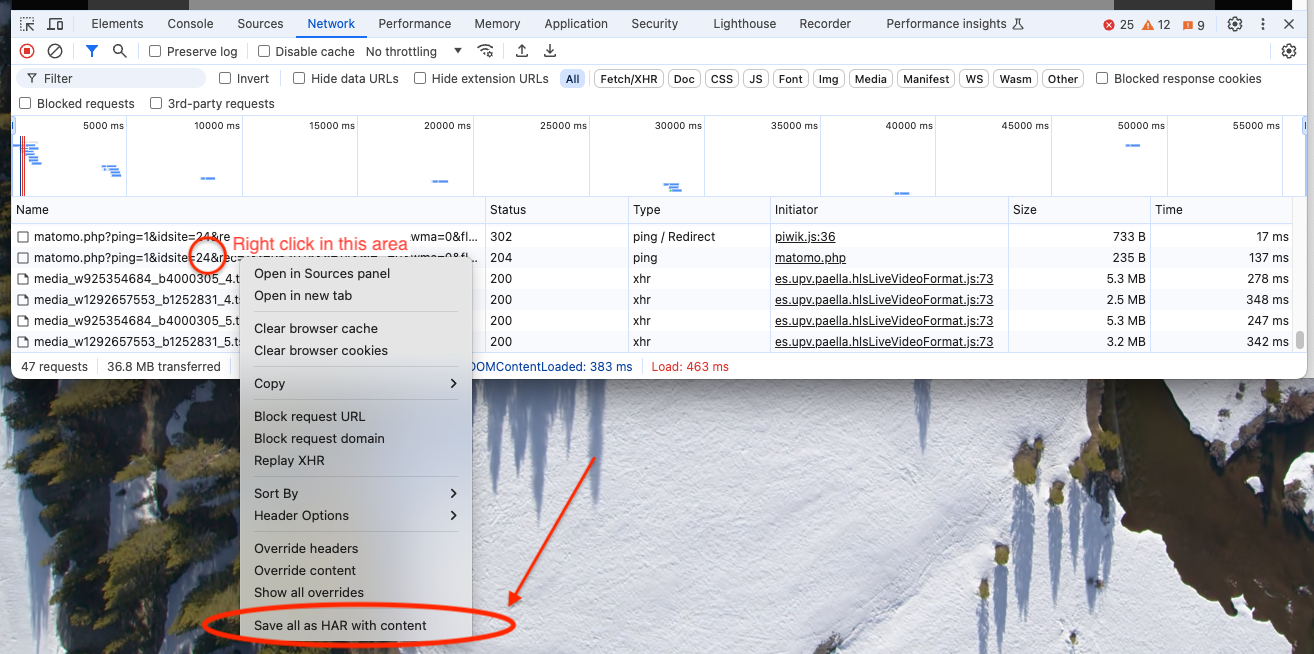
- Click on the "Network tab" in the Developer Tools panel
- Reload de page (Ctrl + R / Cmd + R)
- Click on the play button and keep it running at least 2 minutes.
- Then, click on the content of the "name" column and then select "Save all as HAR with content"
Firefox
Firefox console logs
- Click on the 3 bars menu in the Firefox's navigation menu.
- Go to "More tools" and then "Web Developer Tools.
- Click on the "Console tab" in the Developer Tools panel:

- Right click on the log area and select "Save all message to File"
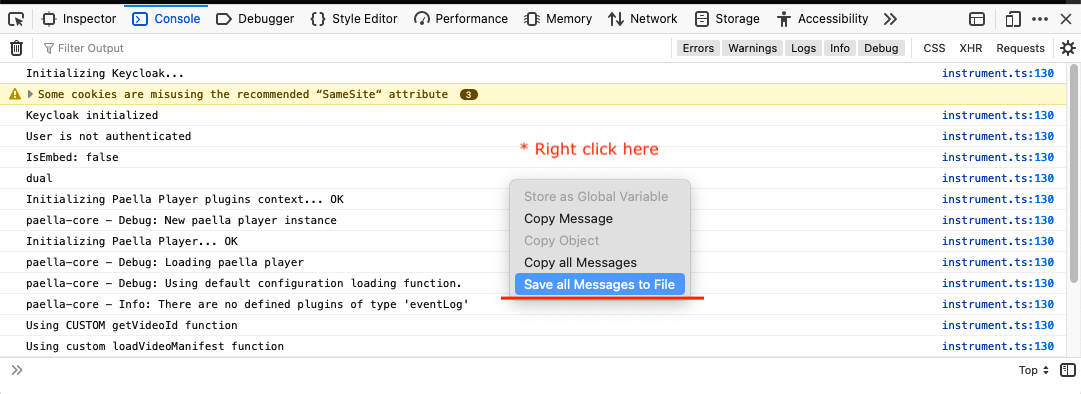
- Finally open the file, copy it's content and add it to the ticket or share the file on the ticket.
Firefox Network usage
- Click on the 3 dots menu in the Firefox's navigation menu.
- Go to "More tools" and then "Web Developer Tools.
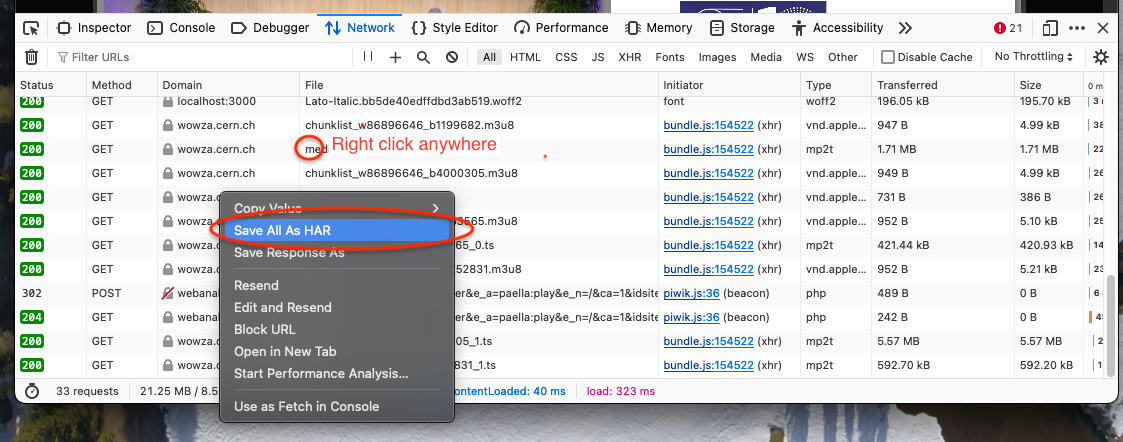
- Click on the "Network tab" in the Developer Tools panel
- Reload de page (Ctrl + R / Cmd + R)
- Click on the play button and keep it running at least 2 minutes.
- Then, click on the content of the "name" column and then select "Save all as HAR"
Safari
Safari console logs
:safari:
- Click on the "Safari" menu item and then "Settings...".
- Go to the "Advanced" tab and check "Show develop menu in menu bar". Close settings.
- In the menu bar, select "Develop" and then "Show Javascript console".
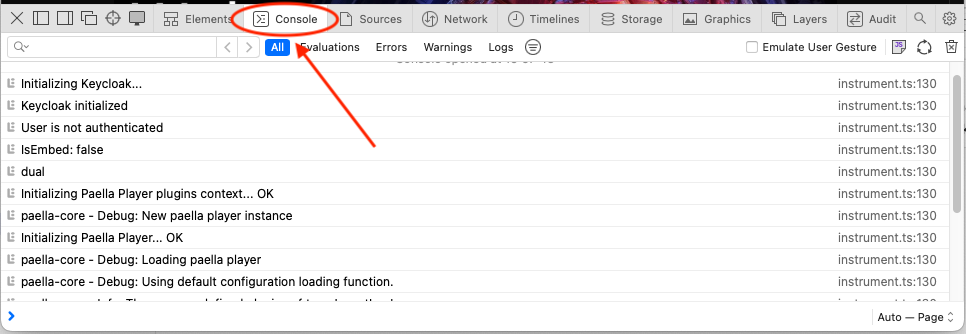
- Press "cmd + a" to select all the logs. Then, right click on the logs area and select "Save selected".
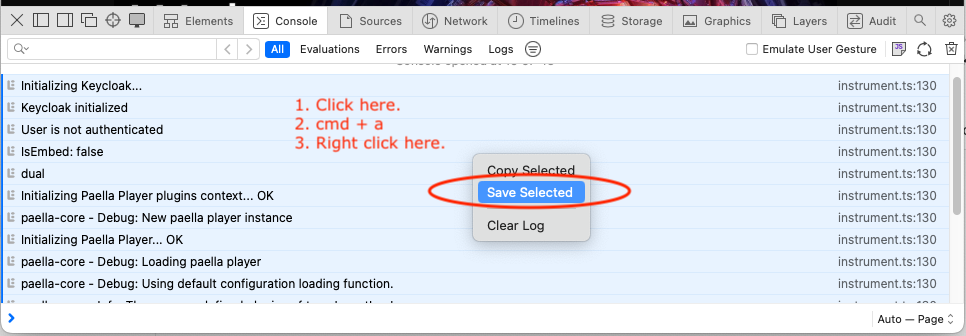
- Finally open the file, copy it's content and add it to the ticket or share the file on the ticket.
Safari Network logs
- Click on the "Safari" menu item and then "Settings...".
- Go to the "Advanced" tab and check "Show develop menu in menu bar". Close settings.
- In the menu bar, select "Develop" and then "Show Javascript console".
- Go to the "Network" tab.
- Reload de page (Ctrl + R / Cmd + R)
- Click on the play button and keep it running at least 2 minutes.
- Then, click on the "Export" button on the top right corner.
