Check statistics from a webcast
You can monitor the statistics of an event on the Webcast Service Stats page (accessible only to CERN accounts).
Please note that the data resolution (interval) in Grafana affects how smooth or detailed the graphs appear — a shorter interval shows more fluctuations (more “spiky”), while a longer interval produces a smoother curve. You can change this using the Interval dropdown at the top of the Grafana dashboard. Please check Annex 1 to see an example of this.
To view the statistics of an event:
- Adjust the time range in the Grafana dashboard to include the event period.
- Locate it using the Indico event ID.
- Take a screenshot for archival purposes — data is only stored for one year.
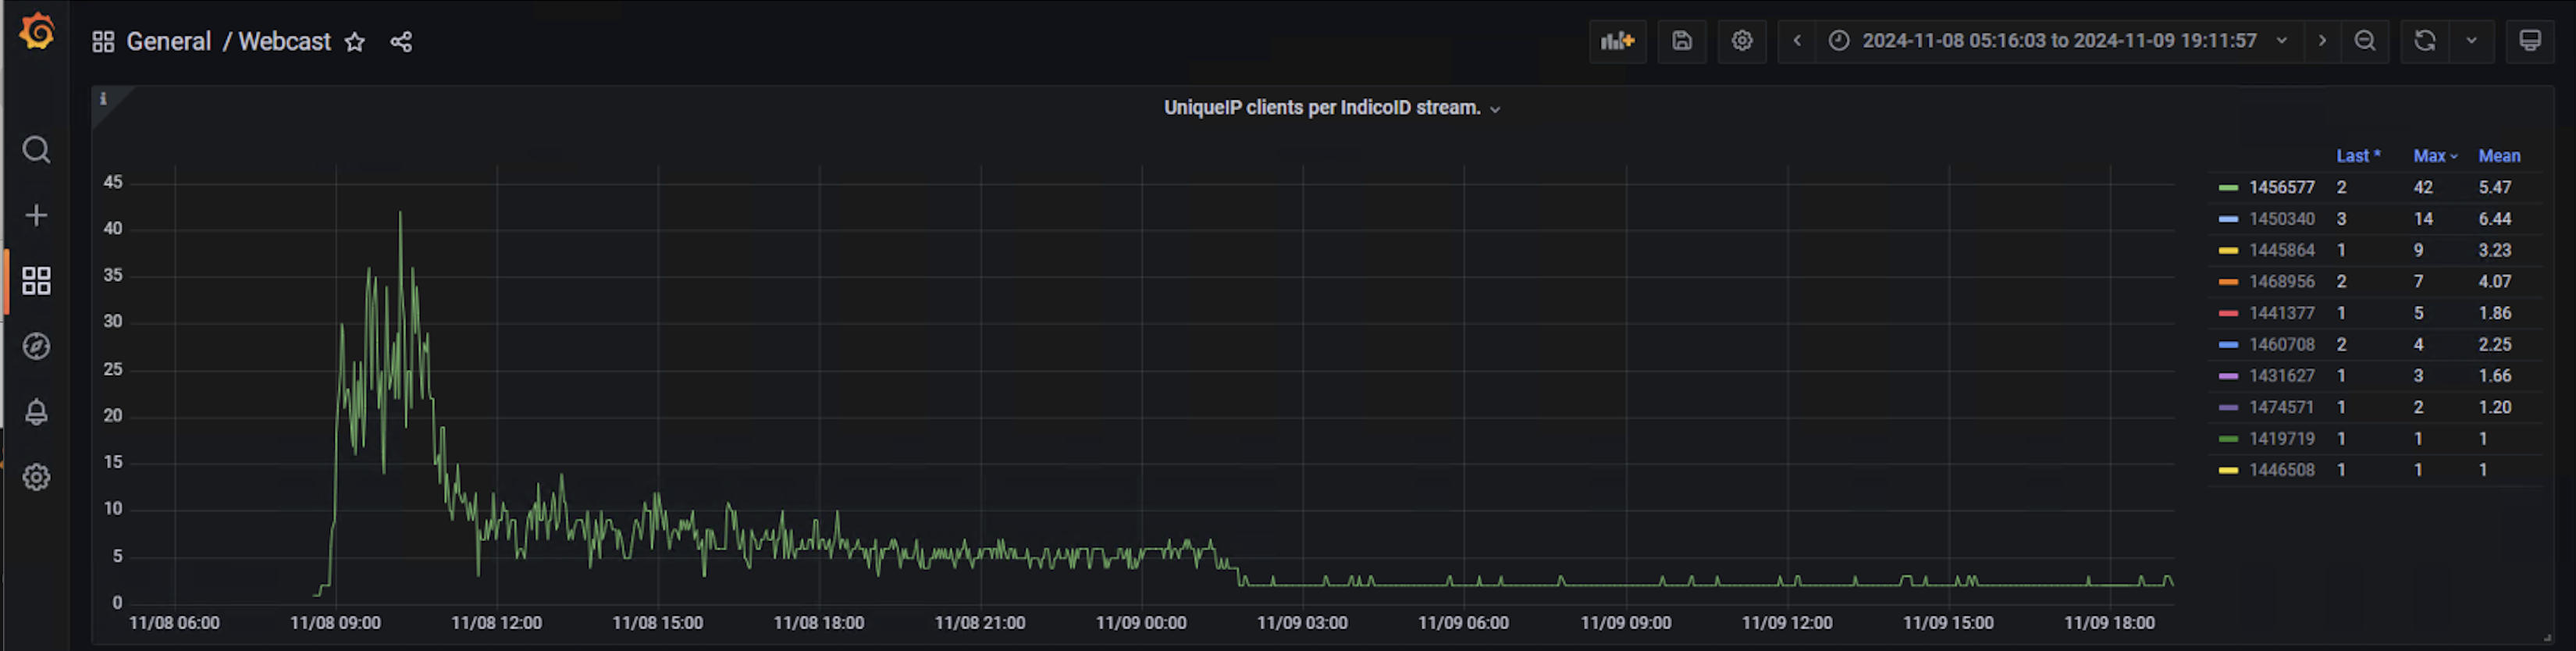
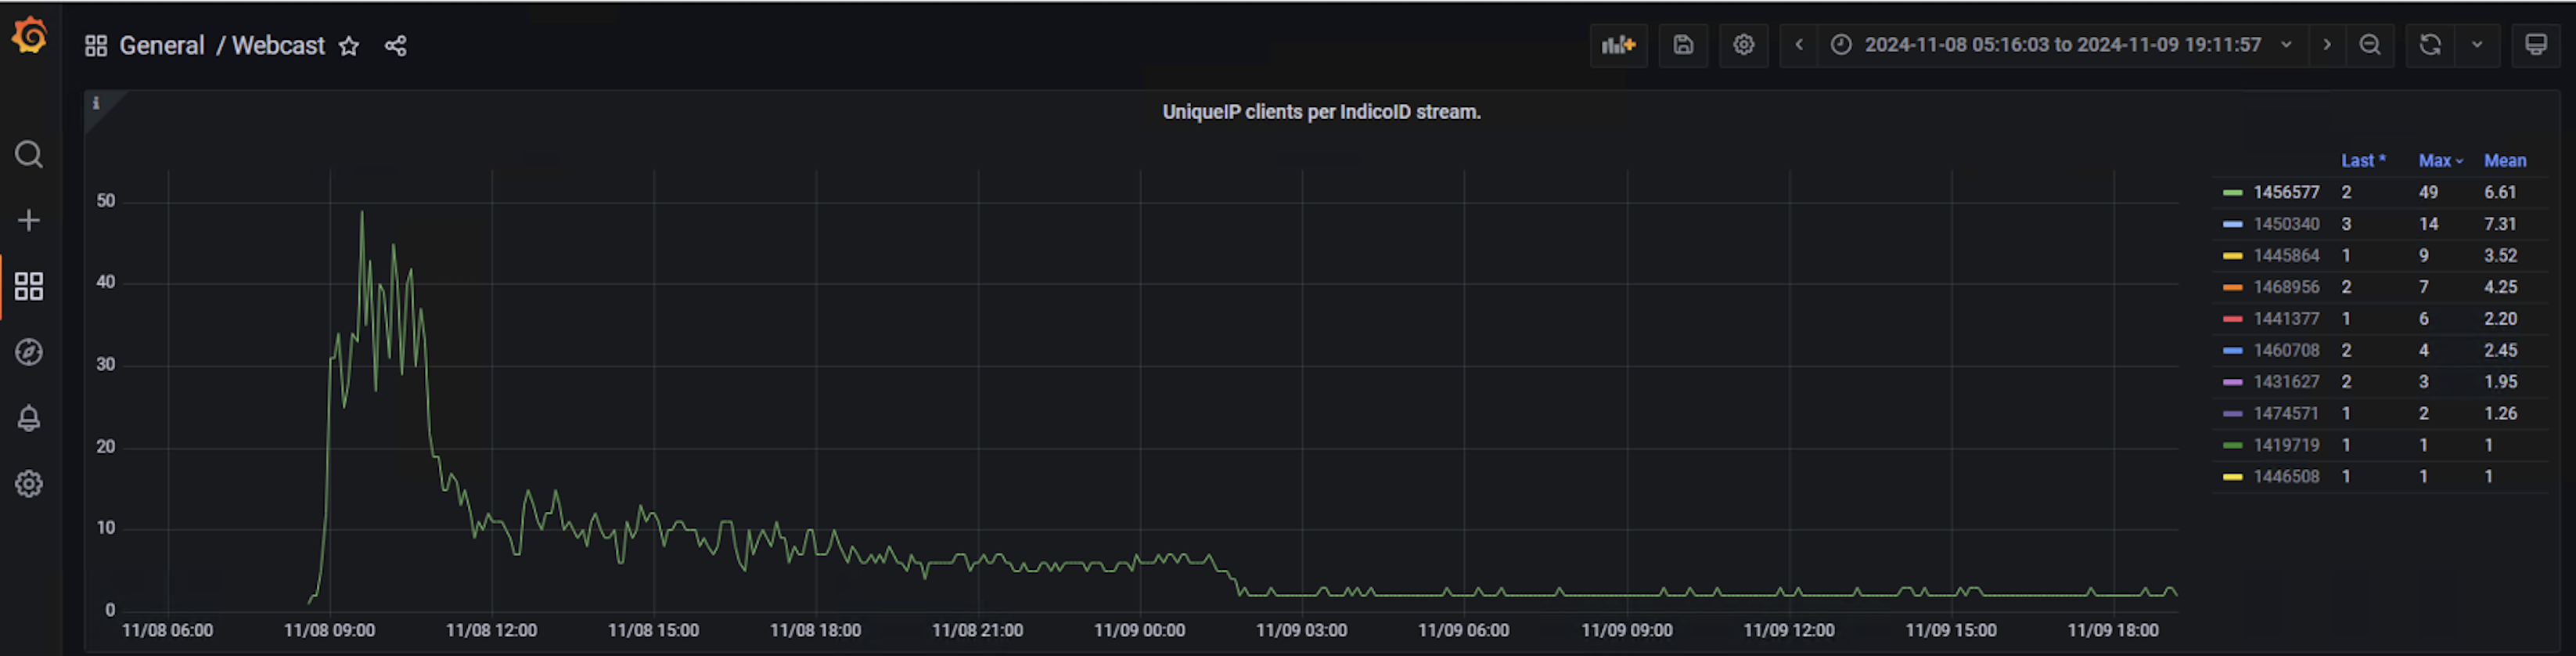
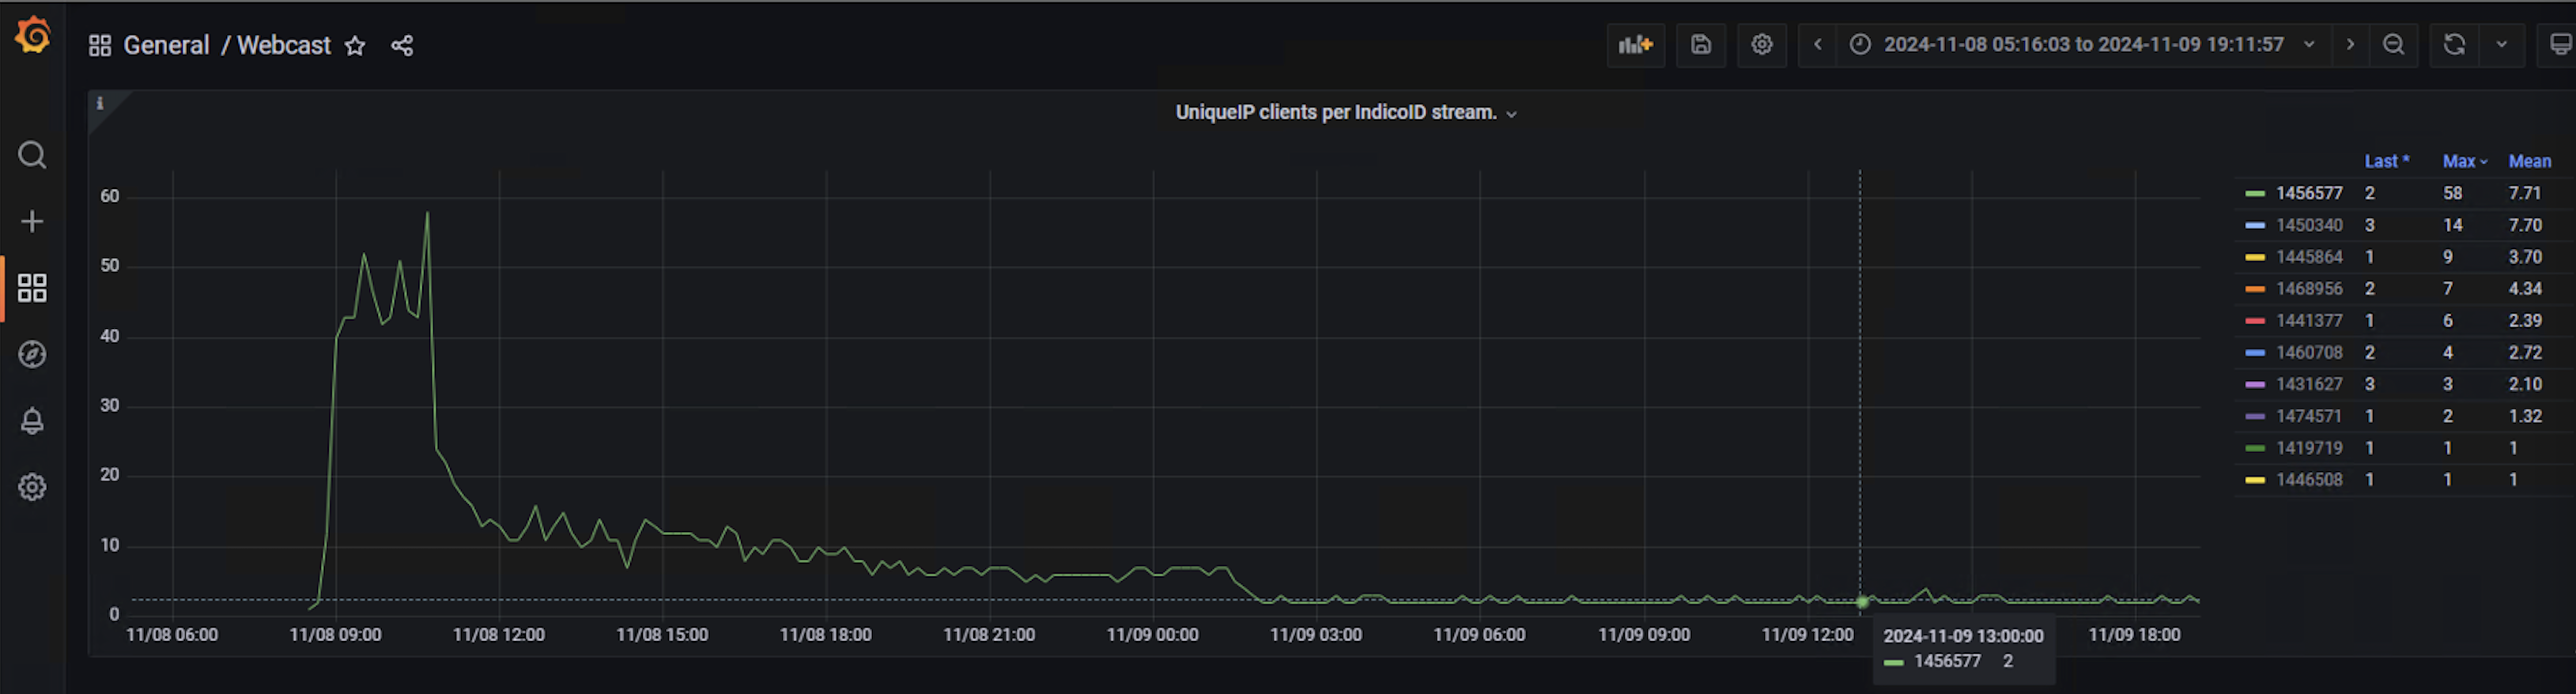
Annex 1
These graphs show how, for the same event, the representation can vary depending on the interval selected. In this example, the interval has been progressively increased to 20 minutes: